External Monitoring for My K3s Cluster
/ 10 min read
Table of Contents
Maintaining a Kubernetes cluster is a complex process where a million things can go wrong at any time inside the cluster. Imagine your cluster is showing high latency. How will you know what the problem is? Is it a faulty deployment, or is it old RAM sticks? Diagnosing such issues can lead to wasting a lot of time, after which you will realise it was just some configurations that caused excessive resource utilization. To make the task of fault isolation easy, we deploy monitoring for our cluster.
Now monitoring for a cluster can be deployed in many ways easiest of which might be using the Helm Chart for prometheus-operator, more recently known as kube-prometheus-stack. This way is easy and requires minimal configuration, but might not be a perfect fit for all the Homelabbers who can’t run heavy workloads or want to handle things themselves. So the other way for this is to host your Prometheus server externally outside the cluster on possibly some other node connected using Tailscale.
Creating External Monitoring Setup
Now let’s just get the constraints for this project straight. We have multiple nodes running a K3s cluster, which we want to monitor for both node and cluster metrics. Let’s also consider that the nodes don’t have publicly routable IP addresses, which is also a common problem faced by homelabbers, and thus are connected by Tailscale.
So first, we need to set up an external suite that houses a few containers necessary for collecting useful metrics and non-K3s containers like standalone Docker containers, if any. These include Prometheus, Grafana, cAdvisor, and Node-exporter. The only con I feel in this method, as compared to the Prometheus-operator Helm Chart, is that the Helm Chart runs Node-exporter as a DaemonSet, so we don’t need to manually deploy Node-exporter on each node.
To deploy the monitoring suite, we can use a common Docker compose file, which also allows us to use container names as hostnames for routing requests in prometheus.yml, because all the containers in a compose belong to a common bridge network.
version: "2"
services:  # This container should only be used if you want to scrape metrics from your tailscale nodes  prometheus-sidecar:    image: tailscale/tailscale:latest    hostname: prometheus-sidecar    environment:      - TS_AUTHKEY=tskey-client-notAReal-OAuthClientSecret1Atawk      - "TS_EXTRA_ARGS=--advertise-tags=tag:prometheus --reset"  # for an OAuth token the joining container will be by default epimeral and have key expiry disabled.      - TS_STATE_DIR=/var/lib/tailscale      - TS_USERSPACE=false    volumes:      - ./prometheus-sidecar/config:/config      - ./prometheus-sidecar/state:/var/lib/tailscale      - /dev/net/tun:/dev/net/tun    cap_add:      - net_admin      - sys_module    restart: unless-stopped
  prometheus:    image: prom/prometheus:latest    container_name: prometheus    restart: unless-stopped    network_mode: service:prometheus-sidecar   # use network_mode and depends_on field only if using a tailscale sidecar containers    depends_on:      - prometheus-sidecar    command:      - '--config.file=/etc/prometheus/prometheus.yml'#    ports:          # use this only if not using for scraping tailscale nodes with sidecar container#      - 7070:9090
    volumes:      - ./prometheus-dev:/etc/prometheus      - ./prometheus-data:/prometheus
  grafana:    image: grafana/grafana:latest    container_name: grafana    restart: unless-stopped    ports:      - 3030:3000    volumes:      - ./grafana:/var/lib/grafana
  node_exporter:    image: quay.io/prometheus/node-exporter:latest    container_name: node_exporter    restart: unless-stopped    pid: host    command:      - '--path.rootfs=/host'    volumes:      - '/:/host:ro,rslave'
  cadvisor:    image: gcr.io/cadvisor/cadvisor:latest    container_name: cadvisor    restart: unless-stopped    devices:      - /dev/kmsg    ports:      - 5050:8080    volumes:      - /:/rootfs:ro      - /var/run:/var/run:ro      - /sys:/sys:ro      - /var/lib/docker/:/var/lib/docker:ro
A few things to note, cAdvisor and Node-exporter require mounting the root file system as they require metrics related to system information. The Prometheus-sidecar container is used to connect the Prometheus Docker container to your tailnet with the tag:prometheus , which is a custom-created tag that you can use to put restrictions on resources this container can access in your tailnet using tailscale ACLs.
When using multiple nodes, you only need to deploy Prometheus and Grafana on one node and Node-exporter and cAdvisor on all the nodes. The benefit of this setup is that you can monitor both K3s and Docker containers now because K3s has its cAdvisor built in, which only exports the metrics of K3s containers. If you don’t want to monitor any Docker containers, then you can omit the cAdvisor parts in the Docker compose and in prometheus.yml.
The OAuth client token you use here should have DNS read, Device: Core write, and Auth_keys write permissions.
If you performed all steps, you would be able to access your Prometheus UI on “prometheus-sidecar:9090 ” and Grafana on “nodeIP:3030 ” in your tailnet.

K3s Setup for Exporting Metrics to Prometheus
Before configuring Prometheus, we need to set up K3s to export all metrics. By default, K3s only exposes metrics of Kubelet and Kube-APIserver. To expose the metrics of Kube-controller-manager and Kube-scheduler, we need to start K3s with the following values. The values can be added in /etc/rancher/k3s/config.yaml.
# This config file is present in /etc/rancher/k3s/# It defines the configs with which the cluster should run with.# If any change is done in this config then the k3s service must be restarted.
kube-controller-manager-arg:  - "bind-address=0.0.0.0"kube-scheduler-arg:  - "bind-address=0.0.0.0"tls-san:  - "localhost"  - "127.0.0.1"  - "<Node-TailnetIP>"  - "<Node-Tailnet-Hostname>"etcd-expose-metrics: true# etcd logs are exported over http on port 2381etcd-arg:  - "listen-metrics-urls=http://127.0.0.1:2381,http://Node-TailnetIP:2381"   # for metricsnode-ip: <Node-TailnetIP>node-external-ip: <Node-TailnetIP>advertise-address: <Node-TailnetIP>flannel-iface: tailscale0
These settings make all control plane and node-level resources’ metrics accessible over all IP interfaces, to be scraped by Prometheus. Note, this might be fine for dev setups, but in prod, make sure to shift these to the Tailscale interface or even to the loopback interface. In both scenarios, these endpoints will require a TLS certificate and an SA token to connect.
You can check “/var/lib/rancher/k3s/server/db/etcd/config” to know the state of etcd and where it is listening for metrics. If these settings don’t apply even after restarting K3s, try deleting “/var/lib/rancher/k3s/server/db” to reset the cluster, but any previously done configurations on the cluster will be deleted permanently.
Configuring RBAC in K3s
Now that we have exposed endpoints for Prometheus to scrape, we still need to authenticate with the cluster to access any of the metrics. To do so, we need to configure an RBAC (Role-Based Access Control).
Service Account
To keep things clean, we will create a new namespace monitoring for all Prometheus-related components. The following YAML file will create both a new namespace and a Service Account in that namespace. Service Accounts are used in Kubernetes to identify non-user agents that need to access the cluster’s resources, like Prometheus.
# This namespace is created for all monitoring related components.
apiVersion: v1kind: Namespacemetadata:  name: monitoring
---# This service account is for external prometheus server to scrape k3s metrics.
apiVersion: v1kind: ServiceAccountmetadata:  name: prom-ext-api-user  namespace: monitoring
ClusterRole
We need to give this service account read-only access to all resources in our cluster. So we need to define a ClusterRole that will provide our service account cluster-wide access to scrape metrics. We could also use the pre-built cluster-admin role, but it is less secure as it is like root for the cluster and has full access to create, read, update, and delete all resources in the cluster. This is not only an overkill but also a security risk.
# This cluster role is for getting cluster wide read only access to all resources for pr.
apiVersion: rbac.authorization.k8s.io/v1kind: ClusterRolemetadata:  name: prometheus-externalrules:  - apiGroups: [""]    resources:      - nodes      - nodes/metrics      - services      - endpoints      - pods    verbs: ["get", "list", "watch"]  - nonResourceURLs: ["/metrics"]    verbs: ["get"]
This ClusterRole defined in this file has access to metrics related to nodes, services, pods, and the /metrics endpoint of the kube-APIserver.
The metrics exported under nodes/metrics are considered a subresource as they can also be found using kubectl. But the /metrics from kube-APIserver is not considered a resource, as it is only accessible by making an HTTPS request and exports data in Prometheus format. This is why it is included in nonResourceURLs.
The get, list, and watch verbs are used to provide read-only access to resources. Kubernetes resources are grouped into API groups, which is why the API version here is rbac.authorization.k8s.io/v1, which is the RBAC group and not just v1.
ClusterRoleBindings
Now we want to create a ClusterRoleBinding between our cluster role and the service account that we created to grant read access to our service account. As defined in the YAML, it links the prom-ext-api-user to the cluster role of prometheus-external, both of which we have defined earlier.
# This cluster role binding is between prom-ext-api-user in monitoring namespace and prometheus-external cluster role to grant read# access of cluster resources to the external prometheus.
apiVersion: rbac.authorization.k8s.io/v1kind: ClusterRoleBindingmetadata:  name: prometheus-externalroleRef:  apiGroup: rbac.authorization.k8s.io  kind: ClusterRole  name: prometheus-externalsubjects:  - kind: ServiceAccount    name: prom-ext-api-user    namespace: monitoring
Service Account token and CA certificate
Lastly, we need the service account token and CA cert to authenticate as the service account.
In Kubernetes v1.24 and later, Secrets are not automatically created when a ServiceAccount is created. My k3s version is based on Kubernetes v1.32, so we will need to manually create a Secret for our service account.
# This is a secret to access the prom-ext-api-user ServiceAccount in the monitoringnamespace.
apiVersion: v1kind: Secretmetadata:  name: prom-ext-api-user-token  namespace: monitoring  annotations:    kubernetes.io/service-account.name: prom-ext-api-usertype: kubernetes.io/service-account-token
We need to describe the secret to get the base64 encoded SA token, or we can directly derive the decoded SA token in a file kube-sa-token, using:
kubectl -n monitoring get secret prom-ext-api-user-token -o jsonpath=’{.data.token}’ | base64 -d > kube-sa-tokenSimilarly, the CA certificate can be derived in a file ca.crt using:
kubectl -n monitoring get secret prom-ext-api-user-token -o jsonpath=’{.data.ca\.crt}’ | base64 -d > ca.crtNow we are done with our cluster side configurations.
Prometheus COnfiguration
Now we need to configure Prometheus to pull metrics from the cluster, additional cAdvisors, and Node-exporters. For configuring Prometheus, we use a prometheus.yml file from which we can define jobs that we want Prometheus to scrape.
global:  scrape_interval: 15s  scrape_timeout: 10s  evaluation_interval: 15s
scrape_configs:  - job_name: "prometheus"    static_configs:      - targets: ["localhost:9090"]
  - job_name: "node_exporter"    static_configs:      - targets: ["node_exporter:9100"]
  - job_name: "cadvisor"    static_configs:      - targets: ["cadvisor:8080"]
# k3sCongrats!🎉 You have now set up a robust external monitoring system for your K3s cluster.    static_configs:      - targets: ["<MasterNode>:6443"] # masternode IP:6443
  - job_name: "kube-cadvisor"  # internal cadvisor managed by kubelets    scheme: https    metrics_path: /metrics/cadvisor    tls_config:      ca_file: /etc/prometheus/ca.crt    bearer_token_file: /etc/prometheus/kube-sa-token    static_configs:      - targets: ["<WorkerNodes>:10250",] # all worker nodes running kubelet in the cluster, kubelet exposes metrics on port 10250.
  - job_name: "kube-scheduler"    scheme: https    metrics_path: /metrics    tls_config:      ca_file: /etc/prometheus/ca.crt    bearer_token_file: /etc/prometheus/kube-sa-token    static_configs:      - targets: ["<MasterNode>:10259"] # Master nodes run kube-scheduler which exposes its metrics on port 10259.
  - job_name: "kube-controller-manager"    scheme: https    metrics_path: /metrics    tls_config:      ca_file: /etc/prometheus/ca.crt    bearer_token_file: /etc/prometheus/kube-sa-token    static_configs:      - targets: ["<MasterNode>:10257"] # Master nods run the kube-controller-manager and expose their metrics on port 10257.
  - job_name: "etcd"    scheme: http   # etcd metrics are usually served over HTTP on port 2381    metrics_path: /metrics    static_configs:      - targets: ["<MasterNode>:2381"] # Master nodes run embedded etcd and their metrics are exposed on port 2381.
Now we can copy the prometheus.yml, ca.crt, and kube-sa-token files into the prometheus-dev/ directory with respect to the Docker compose file.
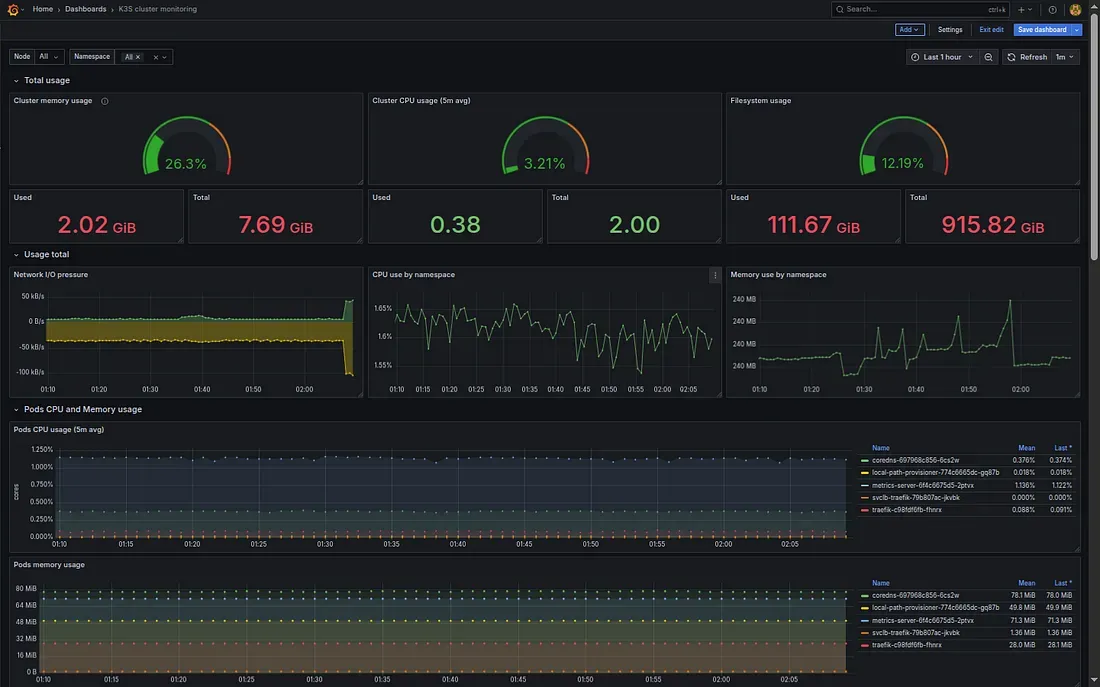
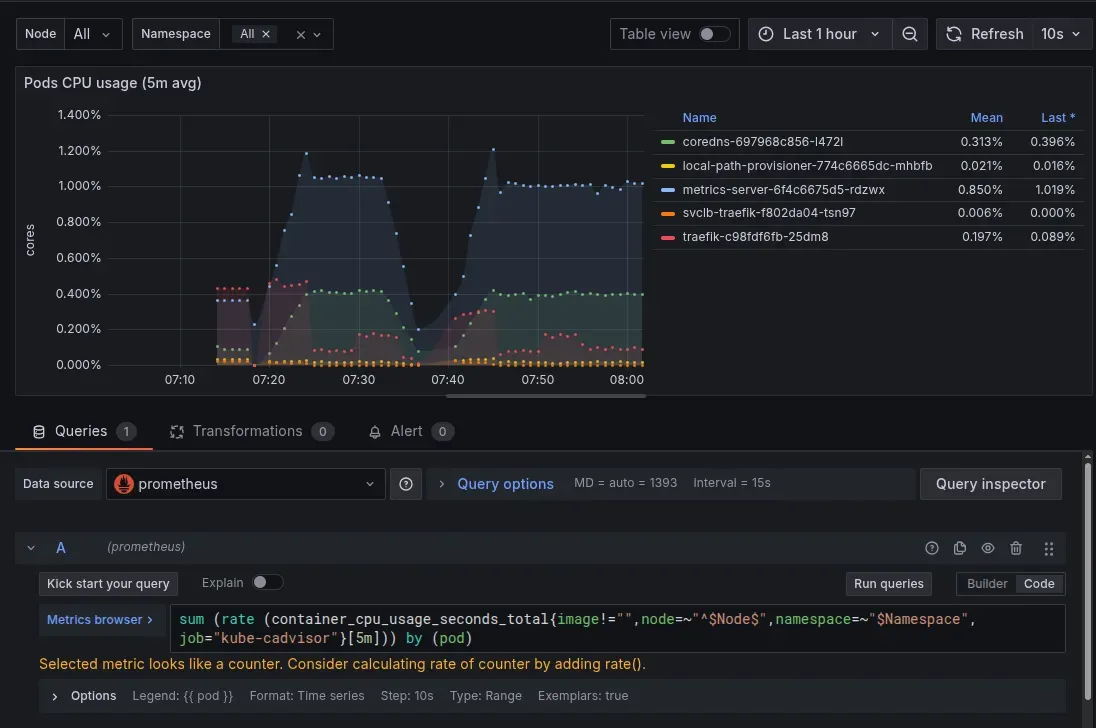
On starting the containers stack, Prometheus will start to fetch metrics from all these sources, and metrics will start to show in the Prometheus UI. NOTE: We are running another cadvisor for Docker containers, so in all the Grafana dashboards that we had set up for K3s pods, we need to add the job filter with value “kube-cadvisor”, and all Docker-specific dashboards will have the value of “cadvisor” in the promQL queries.
Congrats!🎉 You have now set up a robust external monitoring system for your K3s cluster.